Standard indicators of liquidity ratios and solvency. Calculation of enterprise solvency indicators. Analysis of indicators reflecting liquidity and solvency
Solvency characterizes the ability of an enterprise to pay off its payment obligations using assets. A distinction is made between current and general solvency. Current solvency is the ability of an enterprise to pay off its payment obligations at the expense of current assets, and total solvency - at the expense of current and non-current assets. Quite often the expression “current liquidity of the enterprise” is used. The liquidity of an enterprise is characterized by the presence of current assets in an amount sufficient to repay short-term liabilities. The main indicator of the liquidity of an enterprise is:
Current assets > Current liabilities.
The concepts of “solvency” and “liquidity” are very close. The solvency of an enterprise depends on the degree of liquidity of assets. Let us assume that the enterprise has more current assets in value terms than short-term liabilities, which means that the enterprise can be considered solvent. But this is only theoretically, since in the composition of current assets, a larger share can be occupied by slowly realizable assets, the period of transformation of which into money does not coincide with the period of repayment of short-term liabilities.
To assess the solvency of an enterprise, the following indicators are used:
1. Absolute liquidity ratio.
2. Quick liquidity ratio.
3. Current ratio.
4. Inventory liquidity ratio.
5. Overall solvency ratio.
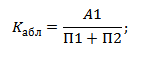
Absolute liquidity ratio (K a.l.) shows what part of short-term liabilities ( KO) can be repaid with the most liquid current assets - cash ( DS) and short-term financial investments ( KFV). Calculated using the formula
Or ![]()
![]() .
.
Quick ratio (To b.l.) shows what part of the company’s short-term obligations can be covered with cash, short-term financial investments and subject to full repayment of short-term receivables ( KDZ). Calculated using the formula
![]()
![]() or .
or .
Recommended value ≥ 0.7–1.0. This means that 70-100% of short-term liabilities should be covered by cash, short-term financial investments and subject to full repayment of short-term receivables.
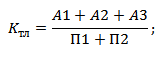
Current ratio (To t.l.) shows to what extent the enterprise can cover short-term liabilities at the expense of all current assets ( OA). When calculating this ratio, cash, short-term financial investments, all accounts receivable, value added tax, inventories, and other current assets are taken into account, i.e. all current assets. Calculated using the formula
Or ![]()
![]() .
.
Recommended value ≥ 2 (optimally ≥ 2–2.5). This means that current assets should be 2–2.5 times higher than the company's short-term liabilities. In textbooks and teaching aids on financial analysis, there is another recommended value for this indicator - from 1.0 to 3.0. Indeed, the value of this indicator depends on the industry characteristics of the enterprise. Thus, for trade, where the turnover of current assets is higher, the value of the current liquidity ratio can vary from 1 to 1.5, and for industrial production and construction - from 1.5 to 2. The lower limit of this indicator cannot be less than one . There should be at least enough current assets to pay off all current liabilities.
In accordance with the methodological provisions for assessing the financial condition of enterprises, the structure of the balance sheet of an enterprise is considered unsatisfactory if the current liquidity ratio is less than two.
Inventory liquidity ratio (To l.t.m.ts.) shows what part of the company’s short-term liabilities can be repaid through the sale of inventories ( Z). When calculating this ratio, inventories are taken into account, with the exception of deferred expenses ( RBP). Calculated using the formula
![]()
![]() or
or ![]()
![]() .
.
The value of this coefficient will depend on the industry of the enterprise. The most common limit is 0.5 – 0.7.
Total Solvency Ratio (To the o.p.) characterizes the ability of the enterprise to cover all its obligations as short-term ( KO), and long-term ( BEFORE), at the expense of all assets ( IA). Calculated using the formula
![]()
![]() or
or ![]()
![]() .
.
Let's calculate and analyze changes in the solvency indicators of an enterprise using the data in Table 1 as an example. 3.1 (Table 3.10).
Table 3.10
Analysis of solvency indicators
As the calculation of the coefficients showed (Table 3.10,
rice. 3.20–3.23), the solvency of the enterprise at the end of the year improved in almost all indicators. The exception is the absolute liquidity ratio, which decreased from 0.1 to 0.09 and does not reach the recommended value. The quick liquidity ratio increased and at the end of the year amounted to 0.83, which is higher than the recommended value. The current solvency ratio increased by 14.73%, but its value did not exceed 2. If we are guided by , then we can say that the enterprise still remains insolvent, and the balance sheet structure is unsatisfactory. However, the lower limit of this indicator is maintained (1.69 > 1.0), which means that current assets are 1.69 times higher than its short-term liabilities. Moreover, for industrial and construction enterprises, a current solvency ratio of ≥ 1.5 is allowed. In general, at the end of the year the enterprise can be considered solvent, but not absolutely. The increase in the solvency of the enterprise is associated with an increase in product sales volumes, an improvement in the structure of working capital, an increase in current assets - 109.02% (Table 3.2), a decrease in short-term liabilities (growth rate - 95.02%) and an increase in equity capital. (Table 3.8).
At the end of the analyzed period, the total solvency ratio reaches the recommended value (≥ 2). This means that the company's assets (balance sheet assets) are twice as large as its liabilities.
It should be noted that the reasons for a decrease in solvency may be: a decrease in production volumes and sales of products and work; rising production costs and declining profits; lack of own sources of funds to finance the enterprise’s activities and a significant increase in liabilities; diversion of funds into accounts receivable; accumulation of excess reserves; insolvency of buyers of the company's products.


Rice. 3.20. Dynamics of the absolute liquidity ratio


Rice. 3.21. Dynamics of the quick ratio

Rice. 3.22. Dynamics of the current ratio


Rice. 3.23. Dynamics of the total solvency ratio
According to the methodological provisions for assessing the unsatisfactory structure of the balance sheet, if the current liquidity ratio is less than 2, then the solvency recovery ratio is calculated:

 .
.
If this coefficient is ≥ 1.0, then the enterprise will restore its solvency in the near future (6 months). Since in our case the current liquidity ratio at the end of the year was 1.69, we will calculate the solvency recovery ratio
Solvency recovery ratio< 1, и, следовательно, у предприятия в течение 6 месяцев нет возможности восстановить платежеспособность.
It can be assumed that if the trend of changes in solvency indicators continues next year, then the enterprise will be able to restore its solvency completely
If the current liquidity ratio is greater than 2, the enterprise is considered solvent and in this case the loss of solvency ratio is calculated

 .
.
If this coefficient is ≥ 1, then the enterprise will not lose its solvency in the next three months.
Liquidity and solvency ratios: their importance in financial analysis


What is liquidity? This is the company’s ability to pay off its obligations as quickly as possible. This term applies only to balance sheet assets and reflects their ability to be transformed from property into money. The most liquid funds are money in current accounts, cash, securities and easily marketable current assets. Liquidity ratios are of interest to banks and leasing companies when considering an application for a loan/leasing, to shareholders and owners to determine the current business situation and identify development prospects, to the state - when considering the possibility of a company's participation in government projects and programs, to arbitration managers - to determine the likelihood of bankruptcy of a company , contractors for making decisions on cooperation, as well as the company’s management - for assessing performance results, the current state of affairs, for tactical and strategic planning. Bank liquidity ratios are established by the Central Bank and express the ability of a financial institution to timely fulfill its obligations to creditors, deposit holders and other clients.
Liquidity ratios: types, calculation procedure and optimal values
* The absolute liquidity ratio reflects the company’s ability to repay its most urgent obligations and is determined as follows:
Coefficient abs liquid = (Money in bank account and cash desk + Short-term financial investments) / short-term liabilities
The optimal value of the coefficient is in the range of 0.7-0.8 (according to Russian standards), ideally it should be 1 or more (according to international standards).


* Current ratio = Sum of all current assets/short-term liabilities
It shows how much short-term liabilities are covered by working capital, which is why it is also called the coverage ratio. The generally accepted normal value is greater than 2. This is interpreted as follows: in order to provide a minimum guarantee of investment, current assets must cover current liabilities at least twice.
*Critical liquidity ratio
K CL = (Cash + short-term financial investments + Accounts receivable)/Short-term liabilities
The indicator reflects the share of current liabilities that the company is able to repay using existing and expected funds, and also characterizes the success of working with debtors; its norm is between 0.8 and 1.0.
Solvency of the company
Solvency allows you to assess whether an enterprise can pay short-term and long-term obligations on time and serves as one of the main indicators of financial stability. When analyzing it, financial liquidity ratios are calculated. Their normative values are a mandatory but incomplete condition for solvency. The company must have a reserve of funds in its current account to maintain solvency at the required level. Otherwise, in order to fulfill obligations on time, she will have to take out a short-term loan, which will negatively affect profitability (interest on the loan) and weaken the financial condition of the company (liabilities will increase, liquidity ratios will worsen).
* Total solvency means the time of repayment of obligations and is determined as follows:
To ob. Pl = Debt Capital/Average Monthly Gross Revenue
* Another calculation option is the ability to cover short-term and long-term liabilities with all assets on the balance sheet:
To ob. Pl = Assets/Liabilities


The optimal value is 2.
* Long-term solvency characterizes the ability of an enterprise to pay off long-term loans with its own funds and is calculated using the following formula:
Kdebt pl = Long-term liabilities/equity
When the coefficient is greater than 1, it means there is no such prospect, which increases the risks of investors. The optimal value is 1 or less. A downward trend in the indicator serves as a positive signal because it guarantees the repayment of long-term loans.
Statement of the movement of funds on the current account as confirmation of the conclusions
Of course, liquidity and solvency ratios often do not take into account many factors; they are calculated for a specific date, before and after which the situation may be completely different. Solvency is confirmed by the presence of money in the current account, financial investments, and the state of foreign currency accounts. It is important that the amounts in these assets have an optimal value. Undoubtedly, the more funds at the disposal of the enterprise, the better for creditors - there is confidence in the repayment of debts. But at the same time, even if there is not a large amount in the current account, this does not mean that the company is insolvent. Perhaps the funds will arrive in the near future. To fully assess solvency, you can ask the company to provide an extract from the current account on cash flows.
Liquidity ratio: balance sheet formula and standard value
One of the indicators of a company's performance is the level of liquidity. It assesses the creditworthiness of the organization, its ability to fully pay off its obligations on time. More details about what liquidity ratios exist and formulas for the new balance sheet for calculating each indicator are presented in the article below.
The essence
Liquidity is the extent to which liabilities are covered by the firm's assets. The latter are divided into groups depending on the period of transformation into cash. This indicator evaluates:
- the firm's ability to respond quickly to financial problems;
- ability to increase assets with increasing sales volumes;
- opportunity to repay debts.


Liquidity levels
Insufficient liquidity is expressed in the inability to pay debts and assumed obligations. We have to sell fixed assets, and in the worst case, liquidate the organization. The deterioration of the financial situation is expressed in a decrease in profitability, loss of capital investments of owners, delay in payment of interest and part of the principal debt on the loan.
The quick liquidity ratio (the balance sheet formula for calculation will be presented below) reflects the ability of a business entity to repay debt using the available funds in its accounts. Current solvency may affect relationships with customers and suppliers. If an enterprise is unable to repay its debt on time, its continued existence is in doubt.


Any liquidity ratio (the balance sheet formula for calculation will be presented below) is determined by the ratio of the organization’s assets and liabilities. These indicators are divided into four groups. In the same way, any liquidity ratio (the balance sheet formula for calculation is needed to analyze activities) can be determined separately for quickly and slowly sold assets and liabilities.
Assets
Liquidity is the ability of an enterprise's assets to generate a certain income. The speed of this process is precisely reflected by the liquidity ratio. The balance formula for calculations will be presented below. The larger it is, the better the enterprise “stands on its feet.”
Let's rank assets according to the speed at which they are converted into cash:
- money in accounts and cash registers;
- bills, treasury securities;
- non-overdue debts to suppliers, loans issued, Central Bank of other enterprises;
- stocks;
- equipment;
- structures;
Now let's distribute assets into groups:
- A1 (the most liquid): funds in cash and in a bank account, shares of other enterprises.
- A2 (quickly sold): short-term debt of counterparties.
- A3 (slowly realized): inventories, work in progress, long-term financial investments.
- A4 (difficult to sell) - non-current assets.
A specific asset belongs to one or another group depending on the degree of use. For example, for a machine-building plant, a lathe will be classified as “inventory”, and a unit manufactured specifically for an exhibition will be considered a non-current asset with a useful life of several years.
Liabilities
The liquidity ratio, the formula for the balance sheet of which is presented below, is determined by the ratio of assets to liabilities. The latter are also divided into groups:
- P1 – the most popular obligations.
- P2 - loans with a validity period of up to 12 months.
- P3 – other long-term loans.
- P4 - enterprise reserves
The lines of each of the listed groups must coincide with the degree of liquidity of the assets. Therefore, before making calculations, it is advisable to modernize the financial statements.


Balance sheet liquidity
To carry out further calculations, it is necessary to compare the monetary values of the groups. In this case, the following relationships must be satisfied:
- A1 > P1.
- A2 > P2.
- A3 > P3.
- A4< П4.
If the first three of the listed conditions are met, then the fourth will be fulfilled automatically. However, a shortage of funds in one group of assets cannot be compensated by an overabundance in another, since quickly sold funds cannot replace slowly sold assets.
In order to carry out a comprehensive assessment, the total liquidity ratio is calculated. Balance formula:
L1 = (A1 + (1/2) * A 2 + (1/3) * A3) / (P1 + (1/2) * P2 + (1/3) * P3).
The optimal value is 1 or more.
The information presented in this way is not replete with details. A more detailed calculation of solvency is carried out based on a group of indicators.
Current liquidity
The ability of a business entity to repay short-term obligations using all assets is shown by the current liquidity ratio. Balance formula (line numbers):
Ktl = (1200 – 1230 – 1220) / (1500 – 1550 – 1530).
There is also another algorithm by which you can calculate the current ratio. Balance formula:
K = (OA - long-term debt - debt of the founders) / (short-term obligations) = (A1 + A2 + A3) / (Π1 + Π2).


The higher the indicator value, the better the solvency. Its standard values are calculated for each industry, but on average they range from 1.49 to 2.49. A value less than 0.99 indicates the enterprise’s inability to pay on time, and a value greater than 3 indicates a high proportion of unused assets.
The coefficient reflects the solvency of the organization not only at the current moment, but also in emergency circumstances. However, it does not always provide the complete picture. For trading enterprises, the value of the indicator is less than the normative one, while for manufacturing enterprises it is most often higher.
Urgent liquidity
The ability of a business entity to repay obligations using quickly salable assets minus inventory reflects the quick liquidity ratio. Balance formula (line numbers):
Ksl = (1230 + 1240 + 1250) / (1500 – 1550 – 1530).
K= (term. DZ + multiple. financial investments + DS) / (term. loans) = (A1 + A2) / (Π1 + Π2).
In the calculation of this coefficient, like the previous one, reserves are not taken into account. From an economic point of view, the sale of this group of assets will bring the most losses to the enterprise.
The optimal value is 1.5, the minimum is 0.8. This indicator reflects the share of liabilities that can be covered by cash flows from current activities. To increase the value of this indicator, it is necessary to increase the volume of own funds and attract long-term loans.
As in the previous case, an indicator value greater than 3 indicates an irrationally organized capital structure, which is caused by slow inventory turnover and an increase in accounts receivable.


Absolute liquidity
The ability of a business entity to repay debt with cash reflects the absolute liquidity ratio. Balance formula (line numbers):
Cal = (240 + 250) / (500 – 550 – 530).
The optimal value is more than 0.2, the minimum is 0.1. It shows that the organization can pay off 20% of its current liabilities immediately. Despite the purely theoretical probability of the need for urgent repayment of all loans, it is necessary to be able to calculate and analyze the absolute liquidity ratio. Balance formula:
K= (short-term financial investments + DS) / (short-term loans) = A1 / (Π1 + Π2).
The calculations also use the critical liquidity ratio. Balance formula:
Kcl = (A1 + A2) / (P1 + P2).
Other indicators
Maneuverability of capital: A3 / (JSC - A4) - (P1 + P2).
Its decrease in dynamics is considered a positive factor, since part of the funds frozen in inventories and accounts receivable is released.
Share of assets in the balance sheet: (balance sheet total - A4) / balance sheet total.
Provision of own funds: (P4 - A4) / (JSC - A4).
The organization must have at least 10% of its own sources of financing in the capital structure.

Net working capital
This indicator reflects the difference between current assets and loans and accounts payable. This is that part of the capital that is formed through long-term loans and own funds. The formula for calculation is:
Net capital = OA - short-term loans = line 1200 - line 1500
The excess of working capital over liabilities indicates that the company is able to pay off debts and has reserves for expanding its activities. The standard value is greater than zero. A lack of working capital indicates the organization’s inability to pay off obligations, and a significant excess indicates an irrational use of funds.
Example
The company's balance sheet includes:
- Cash (DC) – 60,000 rubles.
- Short-term investments (SFI) – 27,000 rubles.
- Accounts receivable (RA) – 120,000 rubles.
- OS - 265 thousand rubles.
- Intangible assets - 34 thousand rubles.
- Inventories (PZ) – 158,000 rubles.
- Long-term loans (LC) – 105,000 rubles.
- Short-term loan (CC) – 94,000 rubles.
- Long-term loans – 180 thousand rubles.
Cal = (60 + 27) / (105 + 94) = 0.4372.
The optimal value is more than 0.2. The company is able to pay 43% of its obligations using funds in its bank account.
Let's calculate the quick liquidity ratio. Balance formula:
Ksl = (50 + 27 + 120) / (105 + 94) = 1.09.
The minimum value of the indicator is 0.80. If the company uses all available funds, including accounts receivable, then this amount will be 1.09 times more than existing liabilities.
Let's calculate the critical liquidity ratio. Balance formula:
Kcl = (50 + 27 + 120 + 158) / (105 + 94) = 1.628.

Interpretation of results
The coefficients themselves do not carry any meaning, but in terms of time intervals they characterize in detail the activities of the enterprise. Especially if they are supplemented with other calculation indicators and a more detailed consideration of assets that are taken into account in a specific balance sheet line.
Unliquid inventories cannot be quickly sold or used in production. They should not be taken into account when calculating current liquidity.
In an organization that is part of a holding group, when calculating the liquidity ratio, indicators of internal receivables and payables are not taken into account. The level of solvency is best determined by the absolute liquidity ratio.
Overvaluation of assets will cause many problems. Inclusion of unlikely debt collection in calculations leads to an incorrect (reduced) assessment of solvency and the receipt of unreliable data on the financial position of the organization.
On the other hand, if assets are excluded from the calculations, the probability of receiving income from which is low, it is difficult to achieve standard values of liquidity indicators.
9.4 Analysis of solvency and liquidity.
One of the main characteristics of the financial condition of an organization is its solvency.
Solvency is the ability of an organization to timely and in full repay its payment obligations to the budget, bank, suppliers and other legal entities and individuals as part of normal financial and economic activities.
Solvency is the most important condition for creditworthiness, i.e. whether the organization has the prerequisites for obtaining a loan and the ability to repay it on time.
In order to ensure a unified methodological approach to assessing the solvency of business entities, timely identification of the instability of their financial condition, Resolution of the Council of Ministers of the Republic of Belarus No. 1672 defines solvency indicators (coefficients).
The calculation of solvency ratios and analysis of the financial condition and solvency of business entities is carried out on the basis of the balance sheet as of a certain date.
The coefficients used as indicators for assessing solvency and their standard values are differentiated by type of economic activity:
current ratio characterizes the overall provision of a business entity with its own working capital for conducting business activities and timely repayment of urgent obligations. The current liquidity ratio (Kt.l.) is calculated using formula (9.10):

 , (9.10)
The standard value of the coefficient for trade organizations is 1.0.
working capital ratio characterizes the presence of a business entity’s own working capital necessary for its financial stability. This coefficient is calculated using formula (9.11):
The standard value of the coefficient for the industry is 0.1.
asset coverage ratio of financial liabilities characterizes the ability of a business entity to pay off its financial obligations after the sale of assets. The value of this coefficient is calculated as follows (9.12):
The standard value of the coefficient for all types of economic activity according to the National Classifier of Types of Economic Activities in the Republic of Belarus is no more than 0.85.
Solvency analysis is necessary not only for the enterprise, for the purpose of assessing and forecasting financial activities, but also for external investors and users of reporting information, primarily for banks.
Closely related to the concept of solvency is the concept of liquidity, which can be determined in relation to assets, balance sheet, and organization.
Balance sheet liquidity is defined as the degree to which an organization's liabilities are covered by its assets, the period of conversion of which into money corresponds to the period of repayment of liabilities. It depends on the degree of correspondence between the amount of available means of payment and the amount of short-term debt obligations.
Liquidity of an enterprise is the ability to pay obligations on time. This concept is more general than balance sheet liquidity, which involves finding means of payment only from internal sources. The company can attract borrowed funds from outside.
Balance sheet liquidity is the basis for the solvency and liquidity of the organization as a whole.
Liquidity and solvency are close, but not identical concepts. Liquidity indicators calculated based on the balance sheet data may indicate their satisfactory level, but in essence the organization has overdue obligations due to a slowdown in direct cash turnover, if current assets contain illiquid inventories or overdue receivables.
Liquidity characterizes both the current state of settlements and the prospect of solvency at a certain date.
In the regulatory framework of the Republic of Belarus, these indicators, in fact, have an equal sign.
Analysis of balance sheet liquidity consists of comparing asset items, grouped by the degree of their liquidity, and sources of assets, grouped by the urgency of their payment (Table 9.1).
To determine the liquidity of the balance sheet, a reclassified balance sheet should be compiled by grouping items of assets, equity and liabilities, in accordance with the above classification. Next, a comparison is made of the relevant groups, based on the results of which the level of liquidity is established as of the reporting date.
Table 9.1 – Grouping of assets by degree of liquidity and sources of assets by urgency of payment
|
Sources of assets |
|
|
A 1. The most or absolutely liquid assets Cash and cash equivalents Short-term financial investments. |
P 1. Most urgent obligations Short-term accounts payable; Urgent short-term obligations requiring repayment within a month. |
|
A 2. Quickly selling assets
|
P 2. . medium-term obligations. Short-term loans and borrowings; Short-term part of long-term liabilities; Obligations intended for implementation; Medium-term short-term accounts payable. Other current liabilities. |
|
A 3. Slowly selling assets. Work in progress; Long-term assets intended for sale; Long-term financial investments: Long-term accounts receivable |
P 3. Long term duties. Long-term loans, Long-term loans other long-term liabilities. |
|
A 4.hard-to-sell assets Long-term assets, with the exception of A3. Intangible assets |
P 4. constant liabilities Equity |
The balance sheet is considered absolutely liquid if the following inequalities are met:
A1 > P1; A2 > P2; A3 > P3; A4< П4
The fulfillment of the first three inequalities entails the fulfillment of the fourth.
The minimum necessary condition for recognizing the balance sheet structure as satisfactory is compliance with inequality No. 4. Otherwise, we can draw a conclusion about the risky financial policy of the organization and the use of part of its liabilities to form long-term assets. In this case, the organization does not have its own working capital.
A comparison of the results of the first group reflects the ratio of current receipts and payments for 3 months.
Comparison of the results of the second group shows the trend of changes in current liquidity in the near future, a period from 3 to 6 months.
Comparing the amounts of the first two groups allows you to find out current liquidity.
The comparison in the third group shows promising liquidity in the relatively distant future (12 months or more).
Using liquidity balance data, you can assess the type of current solvency of an organization by comparing individual elements, assets and short-term liabilities.
The possibility of the earliest repayment of obligations reflects the absolute liquidity ratio, showing what part of short-term liabilities can be repaid immediately and is calculated as the ratio of the amount of cash and cash equivalents and short-term financial investments to their short-term liabilities according to formula (9.13):

 , (9.12)
where 260 pages – short-term financial investments;
270 pages – cash and cash equivalents.
The value of the absolute liquidity ratio must be at least 0.2 (instruction No. 140/206).
After calculating the indicators, their dynamics are studied based on data for several years and their factor analysis is carried out.
The influence of second-order factors on changes in the solvency ratio is determined by the method of proportional division or equity participation.
If the indicators, i.e. solvency ratios, are below standard values, the enterprise is declared insolvent.
Under certain conditions, insolvency is recognized as acquiring (sustainable character) or having a stable character (resolution 1672).
The conclusions obtained from the calculation of solvency ratios of business entities are used in preparing preliminary conclusions based on data from economic courts and information on the financial condition of business entities to interested bodies and organizations at their requests.
To assess the efficiency of using the funds of a business entity, an analysis of business activity is carried out.
Standard financial solvency ratios
Table 4
|
Name |
Calculation method |
Normal |
Indicators |
|||||
|
indicator |
Limitation |
|||||||
|
General indicator |
L1=A1+0.5A2+0,ZAZ/ |
|||||||
|
liquidity |
/P1+0.5P2+0,ZPZ |
|||||||
|
Coefficient |
Shows which |
|||||||
|
absolute |
part of the short-term |
|||||||
|
liquidity |
debt |
|||||||
|
organization can |
||||||||
|
repay on account |
||||||||
|
Money |
||||||||
|
Coefficient |
L3=Al+A2/P1+P2 |
Acceptable |
Shows which |
|||||
|
"critical |
meaning |
part of short-term |
||||||
|
obligations may |
||||||||
|
preferably |
be immediately |
|||||||
|
repaid at the expense of |
||||||||
|
funds on various |
||||||||
|
accounts, in |
||||||||
|
short term |
||||||||
|
securities, and |
||||||||
|
also revenues from |
||||||||
|
Calculations |
||||||||
|
Coefficient |
L4= A1+A2+AZ/ |
Necessary |
Shows which |
|||||
|
value 1; |
part of the current |
|||||||
|
liquidity |
optimal not |
obligations under |
||||||
|
loans and payments |
||||||||
|
can be repaid |
||||||||
|
mobilizing everything |
||||||||
|
working capital |
||||||||
|
Coefficient |
L5=A3/(A1+A2+A3)- |
Decrease |
Shows which |
|||||
|
maneuverability |
pco indicator in |
|||||||
|
functioning |
dynamics- |
Functioning |
||||||
|
capital |
positive |
capital is immobilized |
||||||
|
in production |
||||||||
|
stocks and |
||||||||
|
long term |
||||||||
|
accounts receivable |
||||||||
|
debt |
||||||||
|
Share of working capital |
Depends on |
|||||||
|
funds in assets |
industry |
|||||||
|
accessories |
||||||||
|
organizations |
||||||||
|
Coefficient |
Not less than 0.1 |
Characterizes |
||||||
|
security |
having your own |
|||||||
|
own |
working capital |
|||||||
|
means |
organizations, |
|||||||
|
necessary for her |
||||||||
|
financial |
||||||||
|
sustainability |
||||||||
For a comprehensive assessment of liquidity in general, you should use the general liquidity indicator, calculated by the formula:
Ll=A1+0.5A2+0,ZAZ/P1+0.5P2+0,ZPZ
L1 n.g. =1103+0.5x12775+0.3x36539/12456+0.5x261+0.3x2750 = 18452.2/13411.5=1.37;
L1 k.g. = 1.43;
L1 n.g.< L1 к.г.
Using this indicator, changes in the financial situation in the organization are assessed from the point of view of liquidity. This indicator is also used when choosing the most reliable of many potential partners based on reporting.
During the analysis, each of the coefficients given in Table 4 is calculated at the beginning and end of the period. If the actual value of the coefficient does not correspond to the normal limit, then it can be estimated by its dynamics (increase or decrease in value).
Based on the balance sheet data in the analyzed organization, the coefficients characterizing solvency are presented in Table 5.
Coefficients characterizing solvency(in fractions of a unit) Table 5
|
Odds |
Normal |
Deviation |
|||
|
Solvency |
limitation |
||||
|
1. General indicator |
|||||
|
liquidity (L1) |
|||||
|
2. Absolute coefficient |
|||||
|
liquidity (L2) |
|||||
|
3. “Critical” coefficient |
Acceptable |
||||
|
assessments (L3) |
meaning |
||||
|
preferably |
|||||
|
4. Current ratio |
Necessary |
||||
|
liquidity (L4) |
value 1; |
||||
|
optimal not |
|||||
|
5. Maneuverability factor |
Decrease |
||||
|
functioning capital |
indicator in |
||||
|
dynamics - |
|||||
|
positive |
|||||
|
b. Share of working capital in |
Depends on |
||||
|
assets (L6) |
industry |
||||
|
accessories |
|||||
|
organizations |
|||||
|
7. Coefficient |
Not less than 0.1 |
||||
|
self-sufficiency |
|||||
|
means (L7) |
|||||
The absolute liquidity ratio (urgency ratio) is calculated as the ratio of cash and quickly marketable securities (asset section III) to short-term debt (the result of liability section III). It shows how much of the current debt can be repaid as of the balance sheet date or other specific date.
In our calculation, the ratio of cash to short-term liabilities is 0.07:1 (1103:15467) at the beginning of the year and 0.05:1 (746:14167) at the end. This suggests that the company would not be able to pay off its obligations promptly. However, taking into account the low probability that all creditors of the enterprise will simultaneously present their debt claims to it, and taking into account the fact that a theoretically sufficient value for the urgency ratio is the ratio of 0.2: 1, we can tentatively assume the admissibility of the ratios that have developed at the enterprise, easily implementable assets and short-term debt.
The adjusted liquidity ratio is defined as the ratio of cash, securities and accounts receivable (asset section III) to short-term liabilities (result of liability section III of the balance sheet, net). This indicator characterizes what part of current liabilities can be repaid not only from cash, but also from expected receipts for products shipped, work performed or services rendered. According to the balance sheet, this ratio was 0.03:1 at the beginning of the year ((1103 +647): 643 69) and at the end of the year 0.02:1 ((746+647): 66408), i.e. decreased by 1 point. This suggests that only a small part of the obligations can be repaid from proceeds from shipped products, works and services.
The general liquidity ratio (coverage ratio) is the ratio of all current assets (total of section II + total of section III of the asset) to short-term liabilities (total of the liability section III of the net balance sheet). It allows you to determine the ratio of current assets to cover short-term liabilities. Values of this indicator that are in the range from 2 to 3 are considered normal. According to the balance sheet of the analyzed organization, the overall liquidity ratio was equal to 1.37 at the beginning of the year and 1.43 at the end of the year, i.e. increased by 0.06 points, which indicates the fact that the organization has a small amount of resources that are generated from its own sources.
Considering that if the ratio of current assets and short-term liabilities is lower than 1:1, then there is every reason to talk about a high financial risk associated with the fact that the company is not able to pay its bills.
A 1:1 ratio assumes equality of current assets and current liabilities. Taking into account the varying degrees of liquidity of assets, we can confidently assume that not all assets will be sold urgently, and, therefore, in this situation there is a threat to the financial stability of the enterprise.
If the value of the coverage ratio significantly exceeds the 1:1 ratio, then we can conclude that the enterprise has a significant amount of free resources generated from its own sources.
Another indicator characterizing the liquidity of an enterprise is working capital, which is defined as the difference between current expenses and short-term liabilities. In other words, an enterprise has working capital as long as current assets exceed current liabilities (or in general, as long as the enterprise is liquid),
In this regard, it is useful to determine what part of your own sources of funds is invested in the most mobile assets. For this purpose, the so-called maneuverability coefficient is calculated.
Toward agility == working capital/sources of equity
According to our calculations, the agility coefficient is 50417:64369 = 0.783 at the beginning of the year and 50547:66408 = 0.761 at the end, which generally confirms the previously made conclusions regarding the structure of the sources of formation of current assets in the enterprise.
Various liquidity indicators allow not only to characterize the stability of the financial condition of the organization with different degrees of accounting for the liquidity of funds, and meet the interests of various external users of analytical information. For example, for suppliers of raw materials and materials, the absolute liquidity ratio is most interesting. The bank giving a loan to this organization pays more attention to the “critical” assessment coefficient.
Buyers and holders of company shares largely assess the financial stability of the organization by the current liquidity ratio.
Using these coefficients, you can assign an organization to a particular creditworthiness class. But the difficulty is that:
Standard values of liquidity ratios for organizations of various industries have not been established;
The relative importance of the evaluation indicators has not been determined and there is no algorithm for calculating the generalizing criterion.
The dynamics of the coefficients LI, L2, L3 of the analyzed organization are generally positive. The “critical” assessment coefficient shows what part of current obligations can be repaid not only at the expense of expected receipts from various debtors. A value of 0.7-0.8 is considered normal, but it should be borne in mind that the reliability of the conclusions based on the results of calculations of this coefficient and its dynamics largely depends on the “quality” of accounts receivable, which can only be revealed using internal accounting data. It is optimal if L3 is greater than 1.5.
For the analyzed organization, the value of this coefficient (L3) is close to the criterion value; at the end of the year it did not change. This is already a positive trend.
The current liquidity ratio (L4) allows you to determine the ratio of current assets to cover short-term liabilities. This is the main indicator of solvency. The normal value of this indicator is considered to be from 1 to 2. In our case, this indicator is 3.96 at the beginning of the year and 4.18 at the end of the year, which suggests that most of the current obligations on loans and payments can be repaid by mobilizing all current assets. facilities. The instability of the economy makes it impossible to standardize this indicator. It must be assessed for each specific enterprise according to its accounting data. If the ratio of current assets to short-term liabilities is lower than 1:1, then we can talk about a high financial risk associated with the fact that the organization is not able to pay its bills. Taking into account the varying degrees of liquidity of assets, it can be assumed that not all assets can be sold urgently, and therefore, there will be a threat to the financial stability of the organization. If the value of coefficient L4 exceeds 1, then we can conclude that the organization has a certain amount of free resources generated from its own sources.
In financial theory there is a provision that the higher the turnover of working capital, the lower the normal level of the current liquidity ratio can be. However, not any acceleration in the turnover of material working capital allows us to consider a lower level of the current liquidity ratio as normal, but only associated with a decrease in material intensity. The connection between the normal current ratio and material intensity can be explained logically: the lower the need for material resources, the smaller part of the funds is spent on purchasing materials and thus the larger part of the funds remains to pay off debts. In other words, an organization can be considered solvent provided that the amount of its current assets is equal to the amount of short-term debt.
The current ratio summarizes previous indicators and is one of the indicators characterizing the satisfactory balance sheet.
resources that are formed Analysis of balance sheet liquidity comes down to checking whether the liabilities in the liabilities side of the balance sheet are covered by assets whose conversion period into cash is equal to the maturity period of the liabilities. From the calculation of the overall liquidity ratio, it became clear that only a small part of the obligations can be repaid from proceeds from shipped products, works and services, and most of the current obligations on loans and settlements can be repaid by mobilizing all working capital. The company has a small amount from its own sources. In general, the dynamics of liquidity ratios (Table 5) of the analyzed organization is positive.
Calculated by division current assets to short-term liabilities(current liabilities). The initial data for the calculation contains the company's balance sheet.
Calculated in the FinEkAnalysis program in the Solvency Analysis block.
Total liquidity ratio - what it shows
Shows the company's ability to pay off current (short-term) obligations using only current assets. The higher the ratio, the better the solvency of the enterprise. This indicator takes into account that not all assets can be sold urgently.
Liquidity ratios are of interest both to the management of the enterprise and to external subjects of analysis:
- absolute liquidity ratio - for suppliers of raw materials and materials;
- total liquidity ratio- for investors;
- quick liquidity ratio - for banks.
Total liquidity ratio - formula
General formula for calculating the coefficient:
Total liquidity ratio - diagram
Was the page helpful?
Synonyms
More found about the total liquidity ratio
- The impact of IFRS on the results of the analysis of the financial position of PJSC Rostelecom
Debt coverage current liquidity ratio > 2 2.145 1.17 -0.975 1.901 1.233 -0.668 4 Total liquidity ratio 2.0-2.5 0.549 0.434 -0.115 0.745 0.501 -0.244 5 Working capital coverage ratio - Company debt management
Loan interest coverage ratio 0.08 -0.05 0.06 Total liquidity ratio 1.16 0.74 0.89 Cash payables coverage ratio % 5.5 5.7 - Liquidity of corporate debt: new tools for financial analysis
We propose to characterize the degree of liquidity of the total amount of debt by the debt liquidity ratio K, which is calculated using formula 2 - Analysis of financial condition over time
Deviation 01/01/2015 from 01/01/2011 Total liquidity ratio L1 1.172 1.243 1.345 1.363 2.152 0.98 Absolute liquidity ratio L2 0.096 - Matrix in working capital management
In the future, the need for external sources of financing working capital - the permissible value of short-term liabilities - is determined based on the total value of current assets determined according to the production program and the value of current assets financed from own funds based on the logic of maintaining an acceptable level of liquidity. The ratio of the total value of current assets to the calculated permissible the value of short-term liabilities is formed by the current ratio - Ranking of enterprises in the group
Current liquidity ratio L4 Operating capital maneuverability ratio L5 JSC Mitinsky Cannery Example 1.225 0.022 0.038 Total capital turnover ratio D1, turnover Duration of capital turnover D2, days Mobile assets turnover ratio D3, - Integral assessment of the working capital management policy of a housing and communal services enterprise
NP MZ 0.10 0.30 Indicators that characterize the liquidity management policy of working capital Total liquidity ratio Kosch ObS TO 1.0 2.0 Quick liquidity ratio Kbyst ObS - Z - Financial stability of the company: problems and solutions
Current ratio 1.622 1.289 1.063 Total liquidity ratio 0.785 0.618 0.502 Source Authoring based on consolidated financial statements of RAO - Improving accounting and analytical support for managing working capital of an organization
Current liquidity ratio Total liquidity ratio Solvency ratio Management impact on achieving assessment indicators for achieving the target management focus - Determining balance sheet liquidity
Kcl > 0.5 0.8. The projected payment capabilities of the company, subject to the repayment of short-term receivables and the sale of existing inventories, taking into account compensation of costs, is reflected by the current liquidity ratio, other names, total liquidity ratio, total coverage ratio, total coverage ratio of short-term debts, circulation ratio Table 2 - Liquidity of the enterprise
There are the following indicators of enterprise liquidity: quick liquidity ratio; urgent liquidity ratio; critical liquidity ratio; intermediate liquidity ratio; current liquidity ratio; total liquidity ratio; absolute liquidity ratio; coverage ratio; solvency recovery ratio; loss of solvency ratio; - Analysis of the integral dynamics of financial and economic activities using rating assessment
In this case, such indicators as the ratio of total liquidity of the balance sheet, the coefficient of financial independence, return on sales and return on assets are considered. However, even the calculated - Financial ratios
Current liquidity ratio Total liquidity ratio Absolute liquidity ratio Coverage ratio Solvency recovery ratio Loss of solvency ratio Coefficient - Relative liquidity indicators
Relative liquidity indicators are the total liquidity ratio of the current liquidity coverage ratio of the quick liquidity ratio of the intermediate liquidity ratio of the acid test ratio - Formation of a credit rating of buyers in order to differentiate the terms of a commercial loan
To do this, you should use the following indicators: general liquidity ratios, autonomy ratios, immobilization ratios, net working capital indicator. Proposed methodology for determining a credit rating - Concept, principles and method of managing investment projects based on product resource intensity factors
The choice is based on the complexity of the action of the general indicator, which takes into account private indicators, the general liquidity coefficient K, the autonomy coefficient, Kfn, the coefficient of provision of own working capital, Ks, and solvency. - The relationship between financial risks and indicators of the financial position of an insurance company
Total turnover ratio 0.77 0.77 0.89 5 Absolute liquidity ratio 0.85 0.97 18.59 6 Autonomy ratio - Statistical analysis of the relationship between capital management indicators and the market value of public companies in Russia
Capital - NWC ratio of total current liquidity Current ratio - CR ratio of own working capital ratio of net - The influence of the turnover of assets and liabilities on the solvency of the organization
Current liquidity ratio ≥ 2 Total solvency ratio ≥ 1 Investment ratio ≥ 1 В В Kovalev - Optimization of the balance sheet structure as a factor in increasing the financial stability of the organization
Forecast values Total current liquidity ratio 1.426 2.329 Absolute liquidity ratio 0.020 0.923 Own working capital coverage ratio
Calculated by division current assets to short-term liabilities(current liabilities). The initial data for the calculation contains the company's balance sheet.
Calculated in the FinEkAnalysis program in the Solvency Analysis block.
Current liquidity ratio - what it shows
Shows the company's ability to pay off current (short-term) obligations using only current assets. The higher the ratio, the better the solvency of the enterprise. This indicator takes into account that not all assets can be sold urgently.
Liquidity ratios are of interest both to the management of the enterprise and to external subjects of analysis:
- absolute liquidity ratio - for suppliers of raw materials and materials;
- current ratio- for investors;
- quick liquidity ratio - for banks.
Current ratio - formula
General formula for calculating the coefficient:
Current ratio - diagram
Was the page helpful?
Synonyms
More found about current ratio
- The influence of the turnover of assets and liabilities on the solvency of the organization
Quick liquidity ratio > 1 Current liquidity ratio 1.0-2.0 L T Gilyarovskaya D V Lysenko D A Endovitsky Absolute ratio - The relationship between liquidity, financial cycle and profitability of Russian companies
CR Current Ratio - current liquidity ratio CCC Cash Conversion Cycle - financial cycle of the company LOGTA Logarithm of Total - Methodological provisions for assessing the financial condition of enterprises and establishing an unsatisfactory balance sheet structure
The basis for recognizing the structure of the balance sheet of an enterprise as unsatisfactory and the enterprise as insolvent is the fulfillment of one of the following conditions - the current liquidity ratio at the end of the reporting period is less than 2 - the equity ratio - Methodical approach to solvency analysis
Let us consider together the official criteria of solvency - the current liquidity ratio and the equity ratio. It is by their level that it is determined whether there is - Analysis of the arbitration manager
- Analysis of financial and economic activities for administrations of constituent entities of the Russian Federation
Absolute liquidity ratio 0.134 0.182 0.233 0.413 0.279 changes 0 0.048 0.051 0.18 0 Current liquidity ratio 0.713 0.64 0.548 0.896 0.183 changes 0 -0.073 -0.092 0.348 0 О carelessness - Assessment of the risk of changes in current liquidity in the processes of restructuring industrial enterprises using outsourcing
Two enterprises Current ratio Before reorganization After reorganization After reorganization After reorganization 1.375 1.364 1.711 1.462 - Analysis of FCD to identify signs of deliberate bankruptcy
Absolute liquidity ratio 0.0313 0.0243 0.0448 0.0135 Current liquidity ratio 0.1765 0.316 0.3668 0.1903 Security of the debtor's obligations with its assets 1.2086 1.2931 1.1906 - Determining balance sheet liquidity
The projected payment capabilities of the company, subject to the repayment of short-term receivables and the sale of existing inventories, taking into account compensation of costs, reflects the current liquidity ratio, other names, the total liquidity ratio, the total coverage ratio, the total coverage ratio of short-term - Current issues and modern experience in analyzing the financial condition of organizations - part 5
Z2 It uses two key indicators on which the probability of bankruptcy of an enterprise depends, the current liquidity ratio Kt l and the share of borrowed funds in assets U z s Their - Ratio analysis of the liquidity state of an enterprise
This indicator is calculated if the current liquidity ratio is less than the standard but there is a tendency for its growth. If the value of this ratio is greater - Features of the balance sheet liquidity audit of commercial organizations
According to the balance sheet data, to characterize the liquidity of an economic entity, it is recommended in the economic literature to calculate, as a rule, three relative indicators that differ in the set of liquid assets considered as covering short-term obligations, the absolute liquidity ratio, the intermediate coverage ratio, the current liquidity ratio. When calculating all these indicators, different numerators and one common one are used - Formation of a scoring model for assessing the creditworthiness of a corporate borrower
Number of points for the weighted range >1 5 Current ratio 0.1072 5 > 1 5 0.75-0.1 4 0.5-0.75 1 0-0.5 0 Ratio - Current issues and modern experience in analyzing the financial condition of organizations - part 4
Quick liquidity ratio 0.407 0.377 0.419 -0.030 0.042 Current liquidity ratio 1.207 1.226 1.255 0.019 0.029 Normative for any of the calculated ratios - Vector method for predicting the probability of enterprise bankruptcy
In work 7, the authors, based on methods of analysis of hierarchies and econometrics, from 36 financial ratios of the methodology for assessing the viability of an organization 9, selected five financial ratios of the model current liquidity ratio criterion of capital productivity profitability of core activities net profit rate ratio of current assets to - Using economic analysis methods in diagnosing financial insolvency
8.7 times Current liquidity ratio Kt l 0.342 0.450 0.292 0.108 131.63 -0.158 64.89 Liability coverage indicator - Financial stability standards for Russian enterprises: industry specifics
Order No. 175 dated April 18, 2011 makes minor adjustments to the current liquidity ratio, setting Ktl > 1 as the standard value, which will be selected - Statistical analysis of the relationship between capital management indicators and the market value of public companies in Russia
In 2008, half of the represented companies had a current ratio that did not exceed 0.915, a quarter of companies had a ratio that did not exceed 0.614, and a quarter - Matrix in working capital management
The ratio of the total value of current assets to the estimated acceptable value of short-term liabilities forms the current liquidity ratio acceptable for a given enterprise. There are two options for calculating the acceptable current liquidity ratio - Balance sheet liquidity as one of the main areas of financial condition
Nalchik Cannery LLC showed that the current liquidity ratio in 2015 was 1.169, in 2016 - 1.947. In 2015
In the article we will analyze the main solvency ratios of an enterprise and the formulas for their calculation.
Solvency of the enterprise. Definition
Solvency is the ability of an enterprise to repay its obligations to borrowers in a timely manner and in full. Solvency determines the financial condition, as a result, a decrease in the level of solvency leads to an increase in the risk of bankruptcy of the enterprise. To assess the financial condition, solvency ratios are used, which provide a quantitative characteristic of the enterprise.
To repay its obligations (loans), an enterprise can use both cash and various types of assets that have varying degrees of liquidity. Thus, the solvency of an enterprise is formed due to two factors:
- the presence of assets of the enterprise of various types;
- the level of liquidity of assets, which is determined by the degree of their realizability.
Enterprise asset structure
Let's consider the structure of the enterprise's assets, which consists of current and permanent assets. Current assets of the enterprise– these are assets that can be converted into cash within one production cycle (1 year). Permanent assets consist of fixed assets of production and are not directly involved in production. All assets of the enterprise are ranked according to the degree of liquidity, i.e. depending on the speed of their implementation (sale) and transformation into cash. The more highly liquid assets an enterprise has, the higher its solvency. Ranking of assets by speed of implementation:
Highly liquid liquid assets (A1)
Highly liquid assets enterprises form a group of current assets and have the maximum speed of implementation and their transformation into cash. The most liquid assets include: cash on hand, short-term financial investments in the bank and securities.
Quickly realizable assets (A2)
Quickly realizable enterprise assets belong to the group of current assets and include accounts receivable (<12 месяцев) и вклады в банк.
Slowly selling assets (A3)
Slow moving assets are included in the group of current assets of the enterprise and include: accounts receivable (> 12 months), inventories of finished products, raw materials, unfinished products and semi-finished products, VAT on acquired value.
Hard to sell assets (A4)
Hard to sell assets are permanent assets of the enterprise and include: buildings and structures, equipment, transport, land, intangible assets: patents, trademarks.
The difference between solvency and the creditworthiness of an enterprise
The concept of an enterprise's solvency is closely related to its creditworthiness. Let's take a closer look at their differences. The main difference is that solvency is the ability to pay off one’s obligations using any type of assets. Creditworthiness reflects to a greater extent the repayment of obligations with the help of medium-term and short-term assets of the enterprise, excluding permanent assets: buildings, structures, vehicles, land, etc. Paying off liabilities with the help of permanent and slowly selling assets leads to a decrease in production capacity, and, consequently, a decrease in financial stability in the long term.
Enterprise solvency ratios
To assess the solvency of an enterprise, the following indicators are used:
Current ratio– reflects the enterprise’s ability to pay off its current obligations using current assets. The calculation formula is as follows:
(analogue: urgent liquidity) – shows the possibility of repaying short-term liabilities with the help of quickly liquid and highly liquid assets. The calculation formula is as follows:

The standard value for the quick liquidity ratio Kbl is >0.7-0.8.
Absolute liquidity ratio– reflects the ability of an enterprise to pay off its short-term obligations with the help of highly liquid assets. The indicator is calculated using the formula:
The standard value for Kabl is >0.2.
– shows the ability of the enterprise to pay off its obligations in full with all types of assets. This indicator includes not only short-term but also long-term liabilities. The calculation formula is the ratio of the weighted sum of assets and liabilities.

If the overall liquidity indicator K o l >1 – the liquidity level is optimal.
The Law “On Insolvency (Bankruptcy)” identifies three coefficients that are used to assess the solvency of an enterprise: the current liquidity ratio, the coefficient of restoration of solvency and the coefficient of loss of solvency. These indicators are currently used in practice as information indicators.
– reflects the enterprise’s ability to restore an acceptable level of current liquidity within 6 months. The formula for calculating the solvency recovery ratio is as follows:

K vp – coefficient of restoration of solvency of the enterprise;
The standard value of the indicator is considered to be Kvp > 1 - reflects the ability of the enterprise to restore the level of solvency within 6 months. If K VP<1 – предприятие не располагает ресурсами для восстановления платежеспособности в течение 6-ти месяцев. К тому же, данный коэффициент строится на анализе тренда по двух периодам, что не является достаточно точным прогнозом динамики платежеспособности.
Loss of solvency ratio– reflects the possibility of a deterioration in the solvency of the enterprise within 3 months. The formula for calculating this indicator is as follows:

K unit – coefficient of loss of solvency of the enterprise;
K tl – current liquidity ratio at the beginning (0) and at the end (1) of the reporting period;
K norms – standard value of the current liquidity ratio (K norms = 2);
T – analyzed reporting period.
Standard coefficient of loss of solvency K p > 1 – the degree of threat of loss of solvency within 3 months is small. K pack< 1 – предприятие может потерять платежеспособность в течение 3-х месяцев. Коэффициент утраты платежеспособности аналогичен коэффициенту восстановления платежеспособности и показывает динамику изменения коэффициента текущей ликвидности предприятия по двум периодам. Это является его существенным недостатком, так как точность оценки направления тренда по двум данным низка.
Summary
In this article, we examined various enterprise solvency ratios and formulas for their calculation. An enterprise needs to quickly monitor the level of its solvency, since it directly determines its financial condition and the sustainability of long-term development. In addition to liquidity ratios, solvency is influenced by the coefficients of capital structure, profitability and turnover, so an enterprise needs to have a system for assessing and diagnosing its financial condition.
|
Index |
Calculation of the indicator |
Notes |
|
|
Current ratio |
Current assets (p.1200) |
Shows how many times short-term liabilities can be covered by current assets |
|
|
Quick ratio |
Cash (p.1250) + Financial investments (p. 1240) + Debit debt (p. 1230) Current liabilities (p.1500) |
Shows what portion of short-term liabilities can be covered by cash, funds in short-term securities and settlement proceeds. |
|
|
Absolute liquidity ratio |
Cash (p.1250) + Financial investments (p. 1240) Short term obligations (p.1500) |
Shows what part of short-term liabilities can be covered by the most liquid funds |
|
|
Coefficient of provision of current activities with own working capital |
Net worth (p.1300) Current assets (p.1200) |
Shows what part of current activities is financed from own funds |
|
|
Maneuverability coefficient of own working capital |
Net worth (p.1300) – Non-current assets (p. 1100) Net worth (p.1300) |
Shows how much of your equity is in mobile form |
|
|
Share of own working capital in covering inventories |
Net worth (p.1300) – Non-current assets (p. 1100) Inventories (p.1210) |
Shows the extent to which inventories are provided with their own funds or require borrowing |
Various liquidity indicators are of interest not only for internal users of financial statements, but also for various consumers of analytical information: absolute liquidity ratio - for suppliers of raw materials and materials, quick liquidity ratio - for banks, current liquidity ratio - for buyers and holders of shares and bonds of an enterprise .
Analysis of financial stability.
The task of financial stability analysis is to assess the degree of dependence of the organization on borrowed sources of financing. This is necessary to answer the questions: how independent is the organization from a financial point of view, is the level of this independence increasing or decreasing, and whether the state of its assets and liabilities meets the objectives of its financial and economic activities. Indicators that characterize independence for each element of assets and for property as a whole make it possible to measure whether the analyzed organization is financially stable enough.
Relative indicators of the financial stability of an enterprise characterize the structure of the capital used by the enterprise from the position of financial stability of development. These indicators make it possible to assess the degree of protection of investors and creditors, as they reflect the company’s ability to repay long-term obligations. This group of indicators is also called indicators of capital structure and solvency or coefficients for managing sources of funds.
Long-term liabilities (credits and borrowings) and equity capital are used primarily for the acquisition of fixed assets, capital investments and other non-current assets. In order for the solvency condition to be met, it is necessary that cash and settlement funds, as well as tangible current assets, cover short-term liabilities.
Indicators of financial stability.
Autonomy (financial independence) coefficient
K auto = ![]() 0.6
0.6
Shows the share of own funds in the total amount of funding sources.
Financial stability ratio
K FU = ![]() 0.7
0.7
Shows what portion is financed from sustainable sources.
Capitalization ratio (leverage)
K cap = ![]()
![]() < 1
< 1
Shows how much borrowed funds the organization raised for each ruble of its own funds.
4. Financial dependency ratio
To Federal Law = ![]() = 1 - K aut
= 1 - K aut ![]() < 0,4
< 0,4
Shows what share of borrowed capital occupies in sources of financing.
Debt coverage ratio with equity capital (financing ratio)
To PD = ![]()
![]() > 1
> 1
Shows what part of the funds is financed from own funds and what part is financed from borrowed funds.
Analysis of the sufficiency of own working capital.
In the course of production activities at the enterprise, there is a constant formation (replenishment) of inventories. For this purpose, both own working capital and borrowed funds (long-term and short-term loans and borrowings) are used. By analyzing the conformity or non-compliance (excess or deficiency) of funds for the formation of reserves and costs, absolute indicators of financial stability are determined. The basis for classifying the financial position of an enterprise according to the degree of stability is the indicators of the provision of reserves and costs with the sources of their formation.
A general indicator of financial independence is the surplus or lack of sources of funds for the formation of reserves, which is determined as the difference in the size of sources of funds and the size of reserves.
Based on the indicator of own working capital, an analysis of absolute indicators and determination of the type of financial stability is carried out.
Availability of own working capital
SOS = Own Capital (p. 1300) – Non-current assets (p. 1100)
Own working capital taking into account long-term liabilities
SDOS = SOS + Long-term liabilities (p. 1400)
3. Sources of formation of reserves and costs
IFZ = SDOS + Short-term liabilities (p. 1500)
characterizes the sufficiency of normal sources of financing the enterprise’s inventories and costs
4. Inventories (p. 1210)
Analytical calculation indicators include the following:
F1 = SOS - W
F2 = SDOS - Z
F3 = IFZ - Z
Depending on the value of F1, F2, F3, the following types of financial stability are distinguished:
Absolute financial stability when
Ф1>0, Ф2>0, Ф3>0.
Normal or relative financial stability:
Ф1 0, Ф2>0, Ф3 >0.
In general, the company has a relatively stable financial condition, but is forced to accept long-term borrowings to pay payments.
Unstable financial condition
Ф1 0, Ф2 0, Ф3 > 0
The company periodically experiences delays in mandatory payments and settlements, a chronic lack of funds, and debts to employees regarding wages.
Crisis financial condition - all indicators are below zero
Ф1 0, Ф2 0, Ф3 0
It is typical if accounts receivable and payable are overdue, loans and borrowings are not repaid on time. Chronic shortage of all types of resources.
Criteria for assessing the insolvency (bankruptcy) of an organization.
In order to timely identify signs of insolvency of organizations, the Federal Department of Insolvency (Bankruptcy) (hereinafter referred to as FUDN) approved Methodological Regulations for assessing the financial condition of enterprises and establishing an unsatisfactory balance sheet structure (Order of FUDN dated August 12, 1994 No. 31 - p).
The bankruptcy of an enterprise is diagnosed using the current liquidity ratio and the equity ratio.
The structure of the organization's balance sheet is considered unsatisfactory, and the organization itself is considered insolvent if one of the following conditions is met.
1. The current liquidity ratio at the end of the reporting period is less than 2 (K TL for the current year.< 2);
2. The coefficient of provision with own funds is less than 0.1 (K OSOS< 0,1).
In the case when at least one of the coefficients is less than the standard value, the solvency recovery coefficient for a period of six months is determined - K VP. It shows the company’s ability to restore solvency within six months and is calculated using the formula:
K VP = K TL per k.g. + 6/T*(To TL for a year – To TL for a new year) / 2,
Similar articles
 Computer operator - specialty Job characteristics, tasks and job responsibilities
 “Everyone has the right to reliable information about the state of the environment” - how to implement it?
 A bird hibernating A bird hibernating
 Calculation of the ballistic (elliptical) trajectory section Pitch program